Embryogenesis in 4D: a developmental atlas for genes and cells
How does a tiny cluster of cells become an embryo with a head, trunk, and tail? And how do thousands of genes coordinate this development? A new imaging method makes it possible to visualize the activity of thousands of genes simultaneously throughout the entire zebrafish embryo. Using this technology, a research team at the University of Basel has created an atlas of all genes and cells involved in turning a cluster of cells into an embryo.
12 March 2026 | Heike Sacher
The interplay between genes and cells during the development of a fertilized egg into an embryo is highly complex. Previous methods captured gene activity only in 2D slices, making whole-embryo visualization impossible and offering limited spatial detail, often missing subcellular patterns.
The new method now enables the research team of Professor Alex Schier at the Biozentrum, University of Basel, to visualize the activities of thousands of genes throughout the entire embryo and link them to cell maturation and movement. The result is a comprehensive atlas of early development, along with new insights into how genes and cells shape the growing embryo. The study was published in Science.
A 4D atlas for genes and cells
“A central question has been: How do thousands of genes work together in an embryo, and how is their activity linked to the movement of cells?” says first author Dr. Yinan Wan. To answer this question, the team developed a new imaging technology called weMERFISH. It enables the direct measurement of the activity of nearly 500 genes in entire tissues with subcellular resolution.

From these measurements, the researchers created an atlas of early embryonic development. “By combining previous single-cell data with our gene activity measurements, we were able to calculate spatial patterns of thousands of genes and the activity of around 300,000 potential regulatory regions,” says Wan. The data are freely accessible through the web platform MERFISHEYES. “The atlas is intended as a resource for developmental biologists around the world.”
When time becomes visible in space
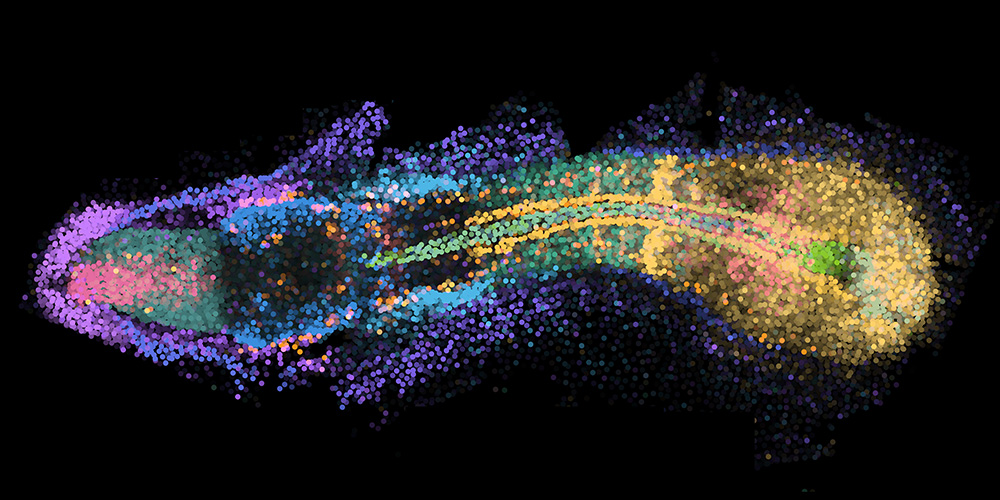
The images provide not just static snapshots but allow conclusions about spatial and temporal processes. For example, during tail formation, the researchers observed that cells along the body axis are arranged in a sequence of developmental stages: at the tip of the tail lie immature stem cells, while farther forward increasingly mature cells, such as muscle cells, can be found. “In a sense, you can see time in space,” explains Wan.
“It was also surprising that changes in gene activity align with how cells move through the embryo, linking gene expression dynamics to morphogenetic movements.”
Sharp boundaries without cell sorting
With the help of the atlas, the researchers were also able to clarify how clear boundaries between different tissues form, for example between muscle and backbone tissue. They discovered a zone of cells in which the activity of many genes changes dramatically and differs from one side to the other.
A comparison of early and later stages showed that these genes are initially active on both sides but later only on one. And there are hardly any cells that cross this boundary. “These boundaries do not arise because cells are intermingled and then sort, but mainly because cells change their genetic program,” says Alex Schier.
Foundation for future studies
With weMERFISH, the MERFISHEYES atlas, and the integration of live imaging, researchers now have a new tool at their disposal. It allows the joint analysis of gene activity, gene regulation, and cell movement across the entire embryo.
In the future, Schier’s team plans to investigate additional developmental stages to further complete the picture of early vertebrate development. “In the long term, we want to understand which combinations of gene activity and cellular behavior are required to form a specific organ or tissue,” says Schier. “One day we may find out how many ways there are to build a heart or a spinal cord.”
Original publication
Yinan Wan et al.
Whole-embryo Spatial Transcriptomics at Subcellular Resolution from Gastrulation to Organogenesis.
Science (2026), doi: 10.1126/science.adt3439