Articel Content
More! (02/2021)
Traces of the pandemic.
Research: Noëmi Kern, Angelika Jacobs, Infographics: Marina Bräm
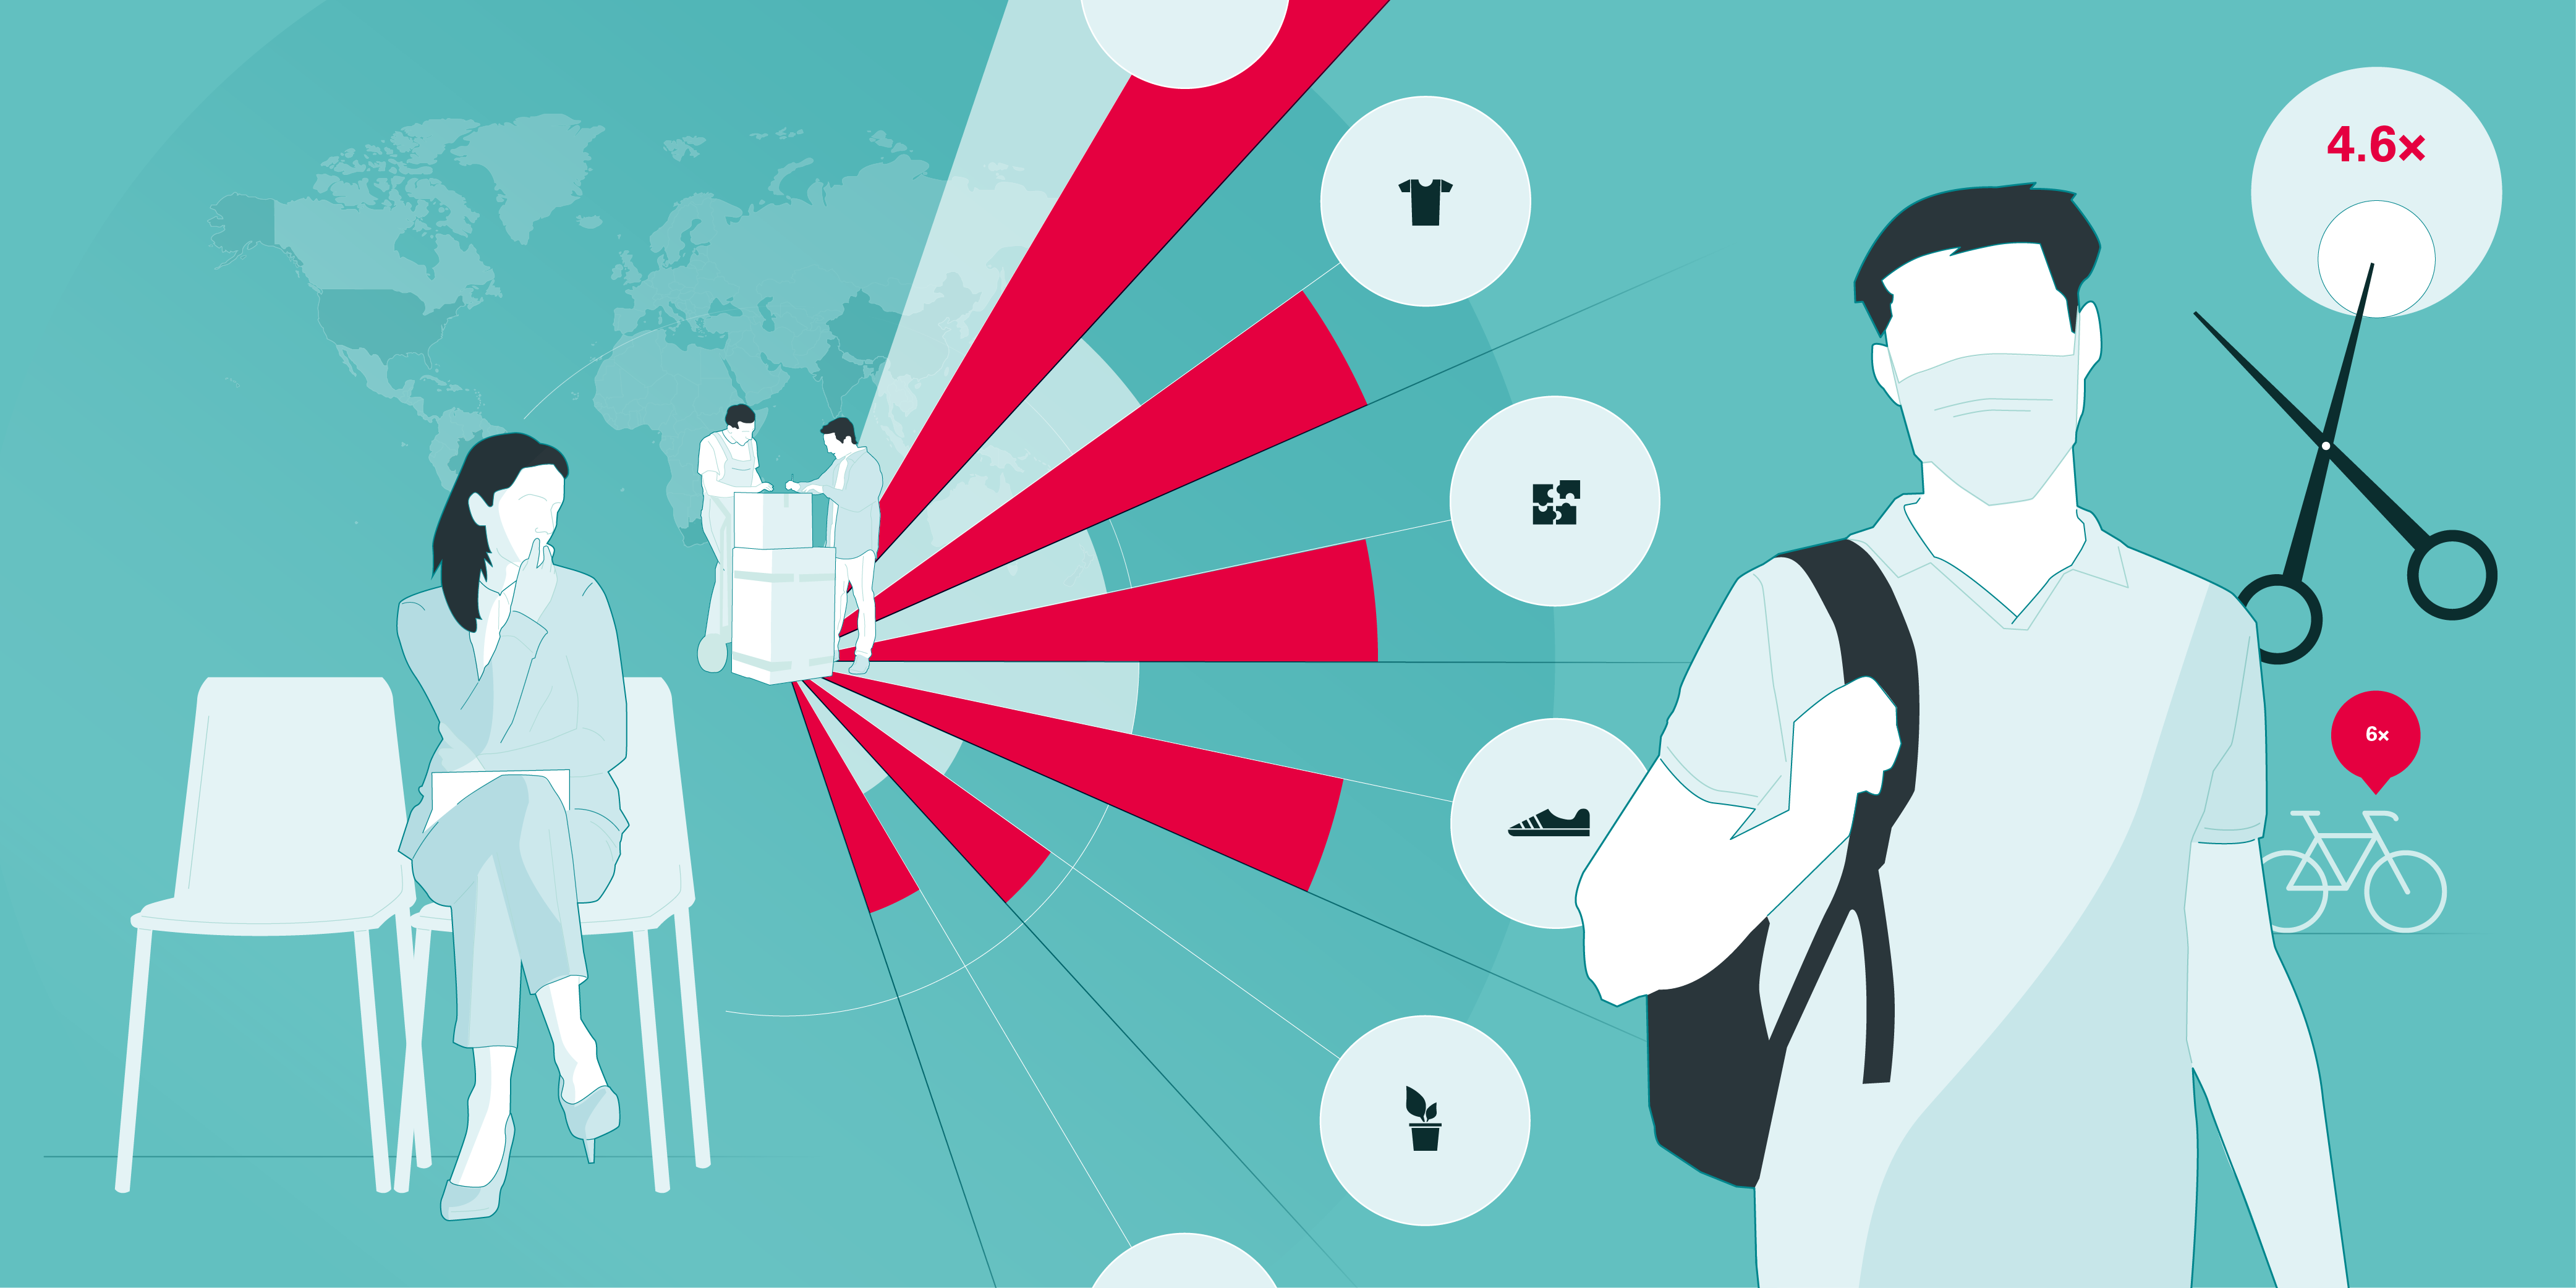
During the pandemic, the focus was – and continues to be – on case numbers, hospital admissions, deaths and vaccination rates. In this series of infographics, we deliberately leave these statistics to one side and examine other things that have grown during – or as a result of – the pandemic.
The coronavirus pandemic caught us completely off guard. From one day to the next, nothing was the same as before – and we had to adapt to changes in many areas of life. We stocked up on what we thought was most necessary, and we considered becoming self-sufficient. Many people avoided handling cash wherever possible.
Infographic series on areas of growth due to the pandemic.
More articles in the current issue of UNI NOVA.
